

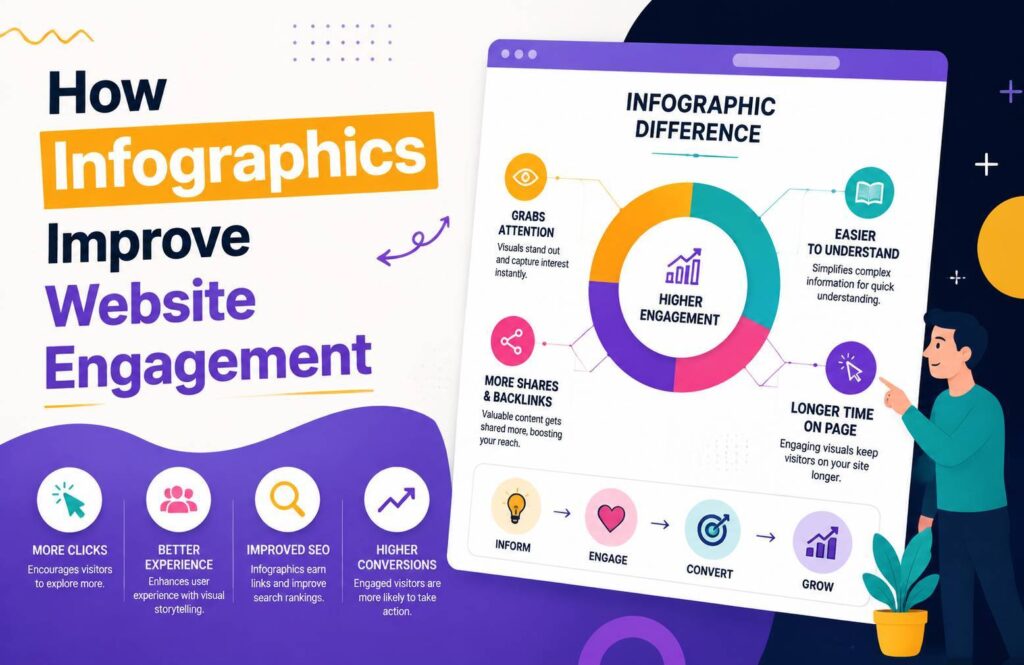
How Infographics Improve Website Engagement is a question many website owners and digital marketers ask when trying to increase traffic, retain visitors, and improve conversions.
In today’s fast-paced digital world, users often skim content instead of reading every word. Infographics combine visuals, icons, charts, and concise text to present information in an easy-to-understand format. They make complex topics simpler, encourage visitors to stay longer, and increase the likelihood of content being shared across social media.
Whether you run a business website, blog, or eCommerce store, adding well-designed infographics can significantly improve your website’s overall performance.
What Are Infographics?
Infographics are visual representations of information, statistics, or processes. Instead of relying only on long paragraphs, they use:
- Icons
- Charts
- Graphs
- Illustrations
- Timelines
- Statistics
- Short descriptions
This combination allows readers to understand information quickly while making content more attractive.
Why Website Engagement Matters
Website engagement measures how visitors interact with your website. High engagement often means users find your content valuable and enjoyable.
Common engagement metrics include:
- Time spent on page
- Bounce rate
- Pages viewed per session
- Social shares
- Comments
- Click-through rate
- Conversion rate
Improving these metrics can also contribute to better search engine rankings.
How Infographics Improve Website Engagement
1. Infographics Grab Attention Immediately
People process visuals much faster than plain text. When visitors land on a page, an attractive infographic immediately captures their attention.
Instead of scrolling past lengthy paragraphs, users stop to explore colorful visuals that summarize important information.
This first impression encourages visitors to continue reading the rest of your content.
2. They Simplify Complex Information
Some topics contain technical data or complicated explanations.
Information Visualization transforms difficult concepts into easy-to-understand graphics.
Examples include:
- Business reports
- Marketing statistics
- SEO strategies
- Health guides
- Product comparisons
- Educational tutorials
Readers can understand the main points within seconds.
3. Increase Time on Page
Engaging visuals naturally encourages visitors to spend more time exploring your content.
When users examine charts, icons, and illustrations, they interact with your page instead of leaving immediately.
Longer session durations signal to search engines that your content provides value.
4. Reduce Bounce Rate
Visitors often leave websites that appear overwhelming.
Infographics break up long blocks of text into visually appealing sections, making content easier to consume.
A better Website User Experience encourages readers to continue browsing other pages.
5. Improve Content Readability
Large paragraphs can discourage readers.
Infographics improve readability by:
- Organizing information
- Highlighting key facts
- Showing step-by-step processes
- Presenting statistics visually
This structure helps visitors quickly find the information they need.
6. Boost Social Media Shares
Visual content performs exceptionally well on social media platforms.
People are more likely to share informative graphics than plain articles.
High-quality infographics perform well on:
- X (Twitter)
More shares increase brand awareness and drive additional website traffic.
7. Support Visual Content Marketing
Modern businesses rely heavily on Visual Content Marketing to attract audiences.
Infographics support marketing campaigns by:
- Explaining products
- Showcasing services
- Sharing industry statistics
- Presenting customer success stories
- Educating potential buyers
They can also be repurposed into presentations, blog posts, videos, and social media content.
8. Improve SEO Performance
While infographics are not a direct ranking factor, they contribute to SEO in several ways.
Benefits include:
- Lower bounce rates
- Longer visit duration
- Increased backlinks
- More social shares
- Better user satisfaction
When combined with optimized content, infographics strengthen your overall SEO strategy.
9. Increase Content Engagement
Interactive and visually appealing pages encourage users to scroll further and explore more content.
Higher Content Engagement often leads to:
- More newsletter signups
- Increased downloads
- More inquiries
- Better conversion rates
Engaged visitors are also more likely to become loyal customers.
Best Practices for Creating Effective Infographics
To maximize results:
- Focus on one clear topic.
- Use accurate and reliable data.
- Keep the design clean and uncluttered.
- Choose readable fonts.
- Use brand colors consistently.
- Optimize image size for fast loading.
- Include your logo and website URL.
- Add descriptive alt text for accessibility and SEO.
Common Mistakes to Avoid
Avoid these common infographic mistakes:
- Using too much text
- Low-quality graphics
- Confusing layouts
- Poor color contrast
- Outdated statistics
- Large file sizes that slow page speed
- Missing calls to action
A simple, organized design often performs better than an overly complex one.
Conclusion
Understanding How Infographics Improve Website Engagement can help businesses create more engaging and effective online content. Infographics simplify information, enhance Website User Experience, support Visual Content Marketing, improve Content Engagement, and make Information Visualization easier for readers to understand.
By incorporating well-designed infographics into your website and blog posts, you can keep visitors engaged, encourage social sharing, improve SEO performance, and build a stronger connection with your audience.
As digital competition continues to grow, visual content remains one of the most effective ways to communicate information and create a memorable online experience.